

If the number of COVID-19 infections and deaths continue to fall, we are going to see more of the UK economy begin to open-up into the post-lockdown world. There will be countless investigations into the true economic cost of the crisis. Such investigations will commence over the next few months, or even years, because right now there simply isn’t enough data to give an accurate reflection.
To generate some credible early insight, the Office for National Statistics (ONS) surveyed businesses across the UK and has been publishing structured datasets with the aim of giving the public the ability to assess the current economic impact of the COVID-19 epidemic. Whilst the ONS is a credible source, creating structured datasets that will inform key decisions solely off opinion-based surveys has limitations. In an environment where verifiable structured data is limited, analysis of unstructured sources could play a much larger part and add new insight.
Beginning in late-April, the ONS has been periodically releasing statistical bulletins titled Coronavirus and the economic impacts on the UK. The data held in these bulletins is broken down in a number of ways, including by industry sector. Using this data, it is possible to grade how severely the ONS sees the impact on each sector. Taking these figures in isolation would tell you that the Human Health and Social Work sector has seen the least impact from the pandemic. This is obviously not the case and highlights one example of how the insights gained from structured data generated using these methods is limited.
AMPLYFI has mined and analysed over 100,000 UK-related documents that discuss the COVID-19 pandemic. Unbiased analysis of this varied source of unstructured data has been used to statistically quantify the strength of the connections between key industrial sectors and COVID-19. The strength of this connection can be used as a soft measure (or inference) to indicate the overall impact on each sector. This is referred to as the AMPLYFI Impact Score (AIS). Figure 1 shows a comparison between the AIS and a comparative score derived from the ONS figures.
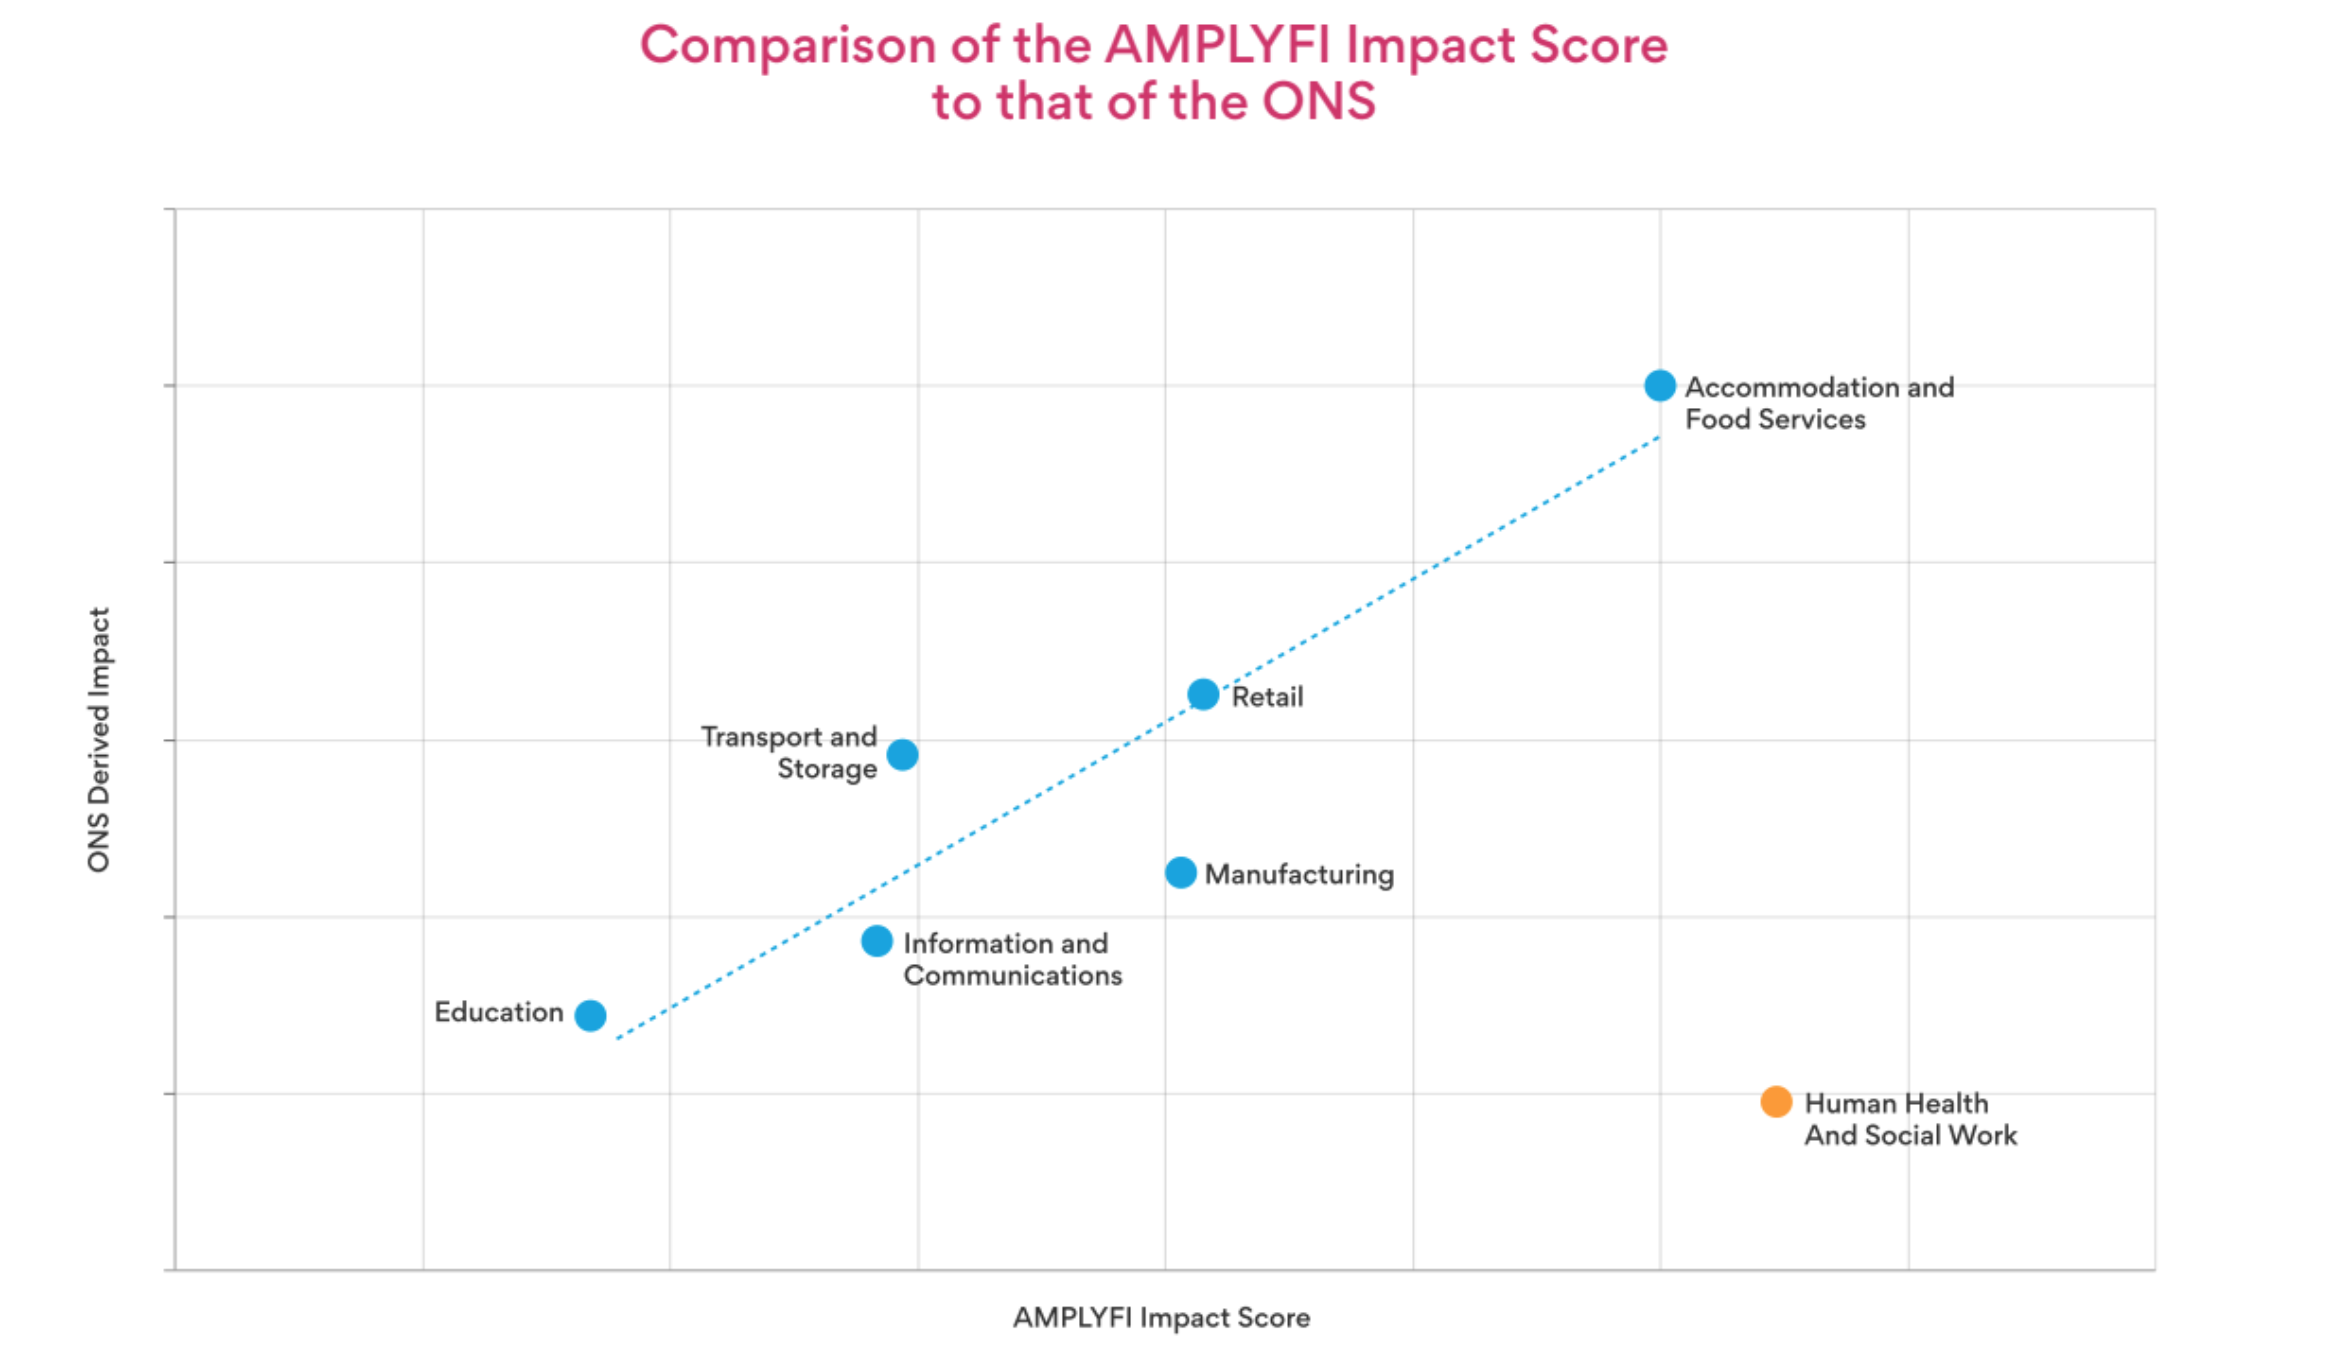
The line on the graph represents the average trend between the two sets of results. If a sector falls below this line, then AMPLYFI is recognising a comparatively stronger impact than the ONS figures. Generally, the key sectors show a strong correlation between their AIS, driven off unstructured data, and those derived from the ONS survey. Industry sectors falling below this line and, therefore, potentially underrepresented by the ONS are Information and Communication, Manufacturing, and Human Health and Social Work. The latter is a significant outlier as the AIS shows the impact to be far more severe than the limited government survey would suggest.
The difference between both sets of results can, to some extent, be attributed to the fact that the AIS is agnostic, meaning positive and negative associations are both driving the impact. On the other hand, the government survey is primarily set up to measure business stress and does not reflect new opportunities linked to the pandemic. In-depth sentiment analysis of the AIS on Information and Communication does in fact show a significant driving force based around new opportunities, we only need to consider the growth in virtual communication to see this in action.
After the outlying Human Health and Social Work sector, the Manufacturing sector is the next furthest below the average trendline and is, therefore, at significant risk of being underrepresented by the ONS assessment of COVID-19 impact. More worryingly, the driving forces behind the AIS show a deeply negative sentiment so the cause of this impact is highly unlikely to be due to increased opportunities. It is more likely that the complex problems being faced by the Manufacturing sector are not being communicated effectively through the ONS survey.
To create its structured dataset, the ONS uses closed questions on their survey. It is extremely difficult to gain revealing insight into a complex problem when respondents only have a small number of pre-determined boxes, or ranges, to choose from. It is exactly this scenario where analysis of unstructured data comes into its own. Machine Learning techniques can analyse unstructured content at scale and generate structured datasets that effectively highlight complex problems and statistically quantify their relative importance. By adopting such Natural Language Processing and Natural Language Processing techniques, the ONS would be able to augment its current research methodology with much needed context from open-source content and open-ended responses.
In a subsequent edition of this report we are going to take a closer look at the unstructured data driving AMPLYFI’s analysis of the Manufacturing sector. This future report will highlight some of the complex issues causing disruption and give extra insight over and above the government figures.